Viewing Satellite Data
NOTE:
The current version supports COMS and NOAA satellite data.
In order to open NOAA satellite data files, you need to save corresponding index files (.idx) in the same folder with satellite data files.
For the terms & names of UI components, refer to UI Components.
1. Add Satellite Images.
To add a satellite image:
- Click Satellite button on Layer menu category.
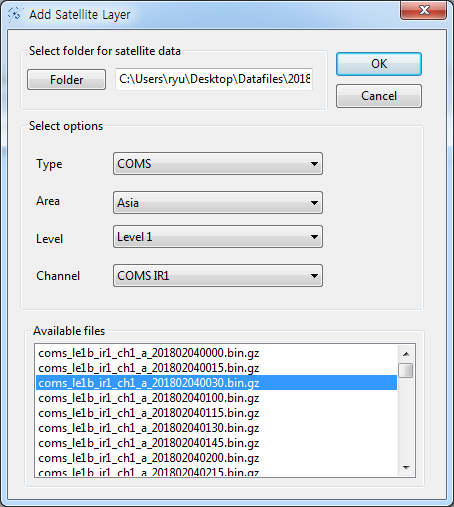
- In Add Satellite Layer dialog:
- Select the folder containing satellite data files;
- Select options for type, area, level, channel;
- Available files box shows the list of data files matching your chosen options. Select the file, then click OK button or double-clicking the file.
2. Change the settings for color mapping (optional).
Double click the vertical Color Bar on the right-hand side of Rendering Pane. In the Setup Colormap and Limit Range dialog, you can change various options regarding the color mapping.
3. Add grid-lines/borderlines (optional).
In Satellite menu category, click the Grid-lines or Borderlines buttons to show the grid-lines or borderlines on the satellite image, respectively.
4. Control the size of the satellite image (optional).
You can control the size of the satellite image by dragging the control handles on Area Pane.
5. Explore the change of satellite data with timeline.
After adding the satellite data and showing it on the Rendering Pane, if there exits other satellite data files with different time steps (for the same channel) in the selected folder, buttons in Data Time panel in Home menu category are enabled.
In order to see the changes of the satellite data over time, you can:
- select the time stamp in the Select Time drop-down list and click the Previous or Next button manually; or
- click the upper part of the Play button and see the change continuously over time. You can also set the time interval and repeat option by clicking the lower part of the Play button.
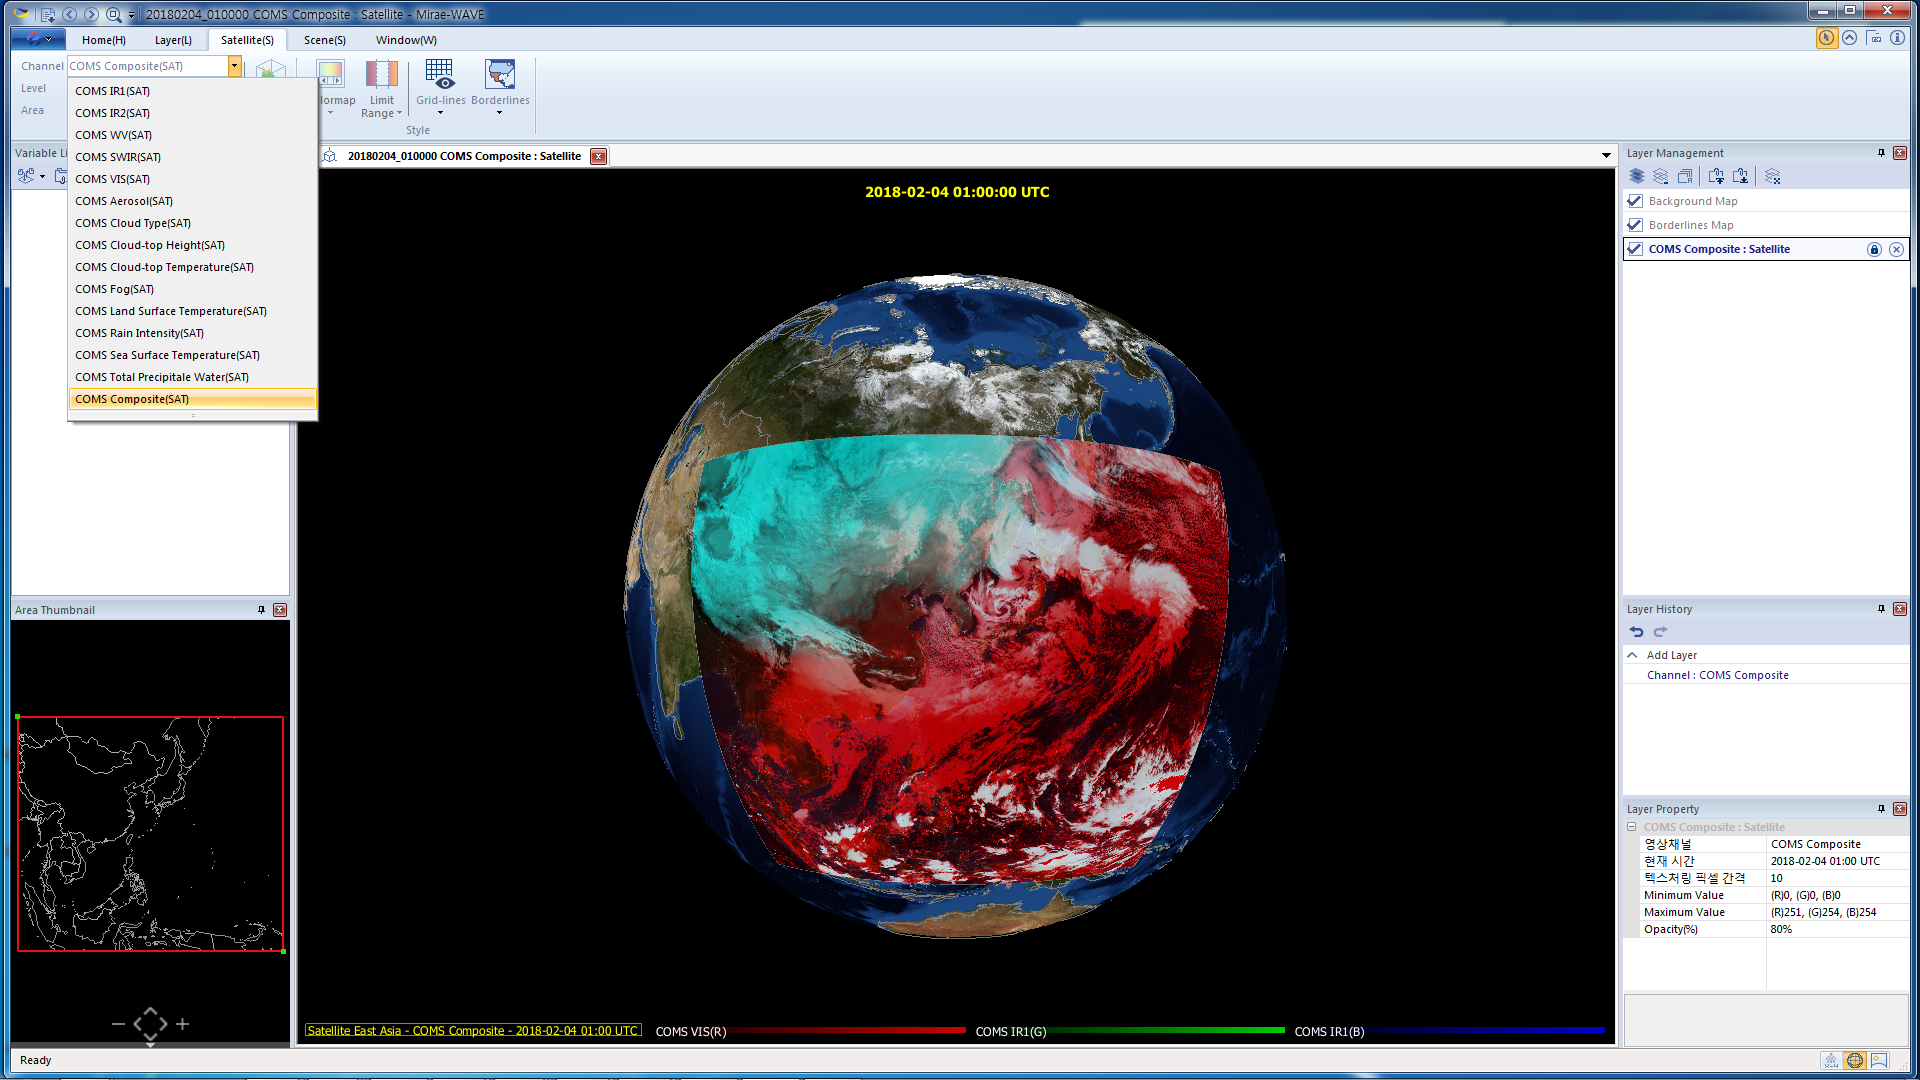
6. Change the SAT channel on the current layer
In Satellite menu category, select the channel in the Channel drop-down list to change the satellite data of the current layer.
| Previous Page | Home (Table of Contents) | Next Page |
|---|